Original AC Phenomena Figures
These are original scan-derived crops from Charles Proteus Steinmetz’s Theory and Calculation of Alternating Current Phenomena, Chapter V, “Symbolic Method.” They are promoted documentary assets with crop manifests and checksums in diagrams/original/theory-calculation-alternating-current-phenomena/figures/.
The crops are not decorative. They show the exact visual bridge Steinmetz builds from vector diagrams to rectangular components, then from rectangular components to the symbolic expression a + jb.
Promoted Crops
Section titled “Promoted Crops”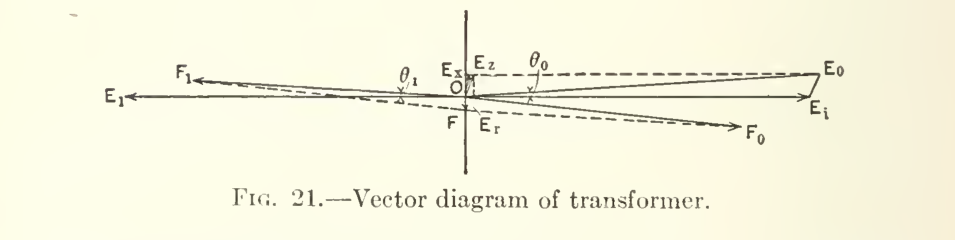
Printed page 30. Shows why a graphical vector diagram gives insight but becomes unsuitable for exact numerical work when magnitudes differ greatly.
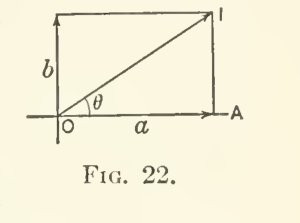
Printed page 31. A sine-wave vector is resolved into horizontal and vertical components, a and b.
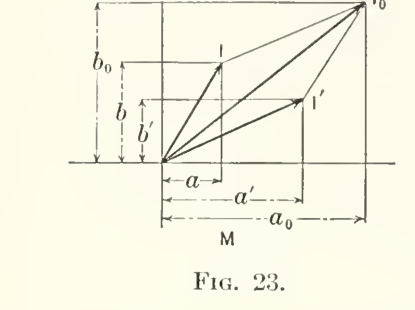
Printed page 32. Component addition turns parallelogram combination into arithmetic on rectangular projections.
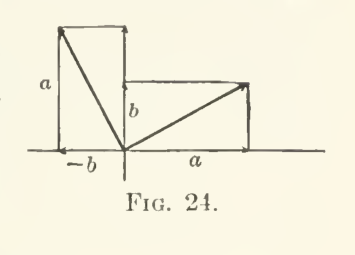
Printed page 33. Shows the geometric reason multiplication by j represents a 90 degree, one-quarter-period phase operation.
Modern Redraw Sheet
Section titled “Modern Redraw Sheet”
This redraw sheet is a reading aid for Figs. 22-24. It preserves the sequence Steinmetz builds: a vector is resolved into rectangular components, component addition becomes calculation, and multiplication by j represents a quarter-period rotation. It is not documentary evidence; the original scan crops above remain the source artifacts.
Source-Grounded Reading
Section titled “Source-Grounded Reading”| Figure | Source Function | Modern Reading |
|---|---|---|
| Fig. 21 | Shows the limits of exact calculation by graphical vector diagram. | Motivates analytic phasor calculation. |
| Fig. 22 | Defines horizontal and vertical components of a sine-wave vector. | Maps magnitude and phase into rectangular components. |
| Fig. 23 | Shows component addition for resultant sine waves. | Equivalent to adding complex phasors component by component. |
| Fig. 24 | Shows phase rotation by one-quarter period. | Geometric interpretation of multiplication by j. |
Manifest Paths
Section titled “Manifest Paths”| Asset | Manifest | Review State |
|---|---|---|
| Fig. 21 | diagrams/original/theory-calculation-alternating-current-phenomena/figures/fig-21-vector-diagram-transformer.png.json | Promoted scan crop; source context located; needs second-pass bibliographic verification. |
| Fig. 22 | diagrams/original/theory-calculation-alternating-current-phenomena/figures/fig-22-rectangular-components.png.json | Promoted scan crop; source context located; needs second-pass bibliographic verification. |
| Fig. 23 | diagrams/original/theory-calculation-alternating-current-phenomena/figures/fig-23-resultant-components.png.json | Promoted scan crop; source context located; needs second-pass bibliographic verification. |
| Fig. 24 | diagrams/original/theory-calculation-alternating-current-phenomena/figures/fig-24-quarter-period-rotation.png.json | Promoted scan crop; source context located; needs second-pass bibliographic verification. |
Related Pages
Section titled “Related Pages”Next Visual Work
Section titled “Next Visual Work”The next AC visual pass should extract figures for impedance, admittance, hysteresis, transformer equivalent diagrams, and power measurement. The next transient visual pass should continue into surge-propagation and distributed-line figures.